
Klungkung Project Overview
INPAC SOLUTIONS
Klungkung TOSS Facility | Operational & Asset Model Report
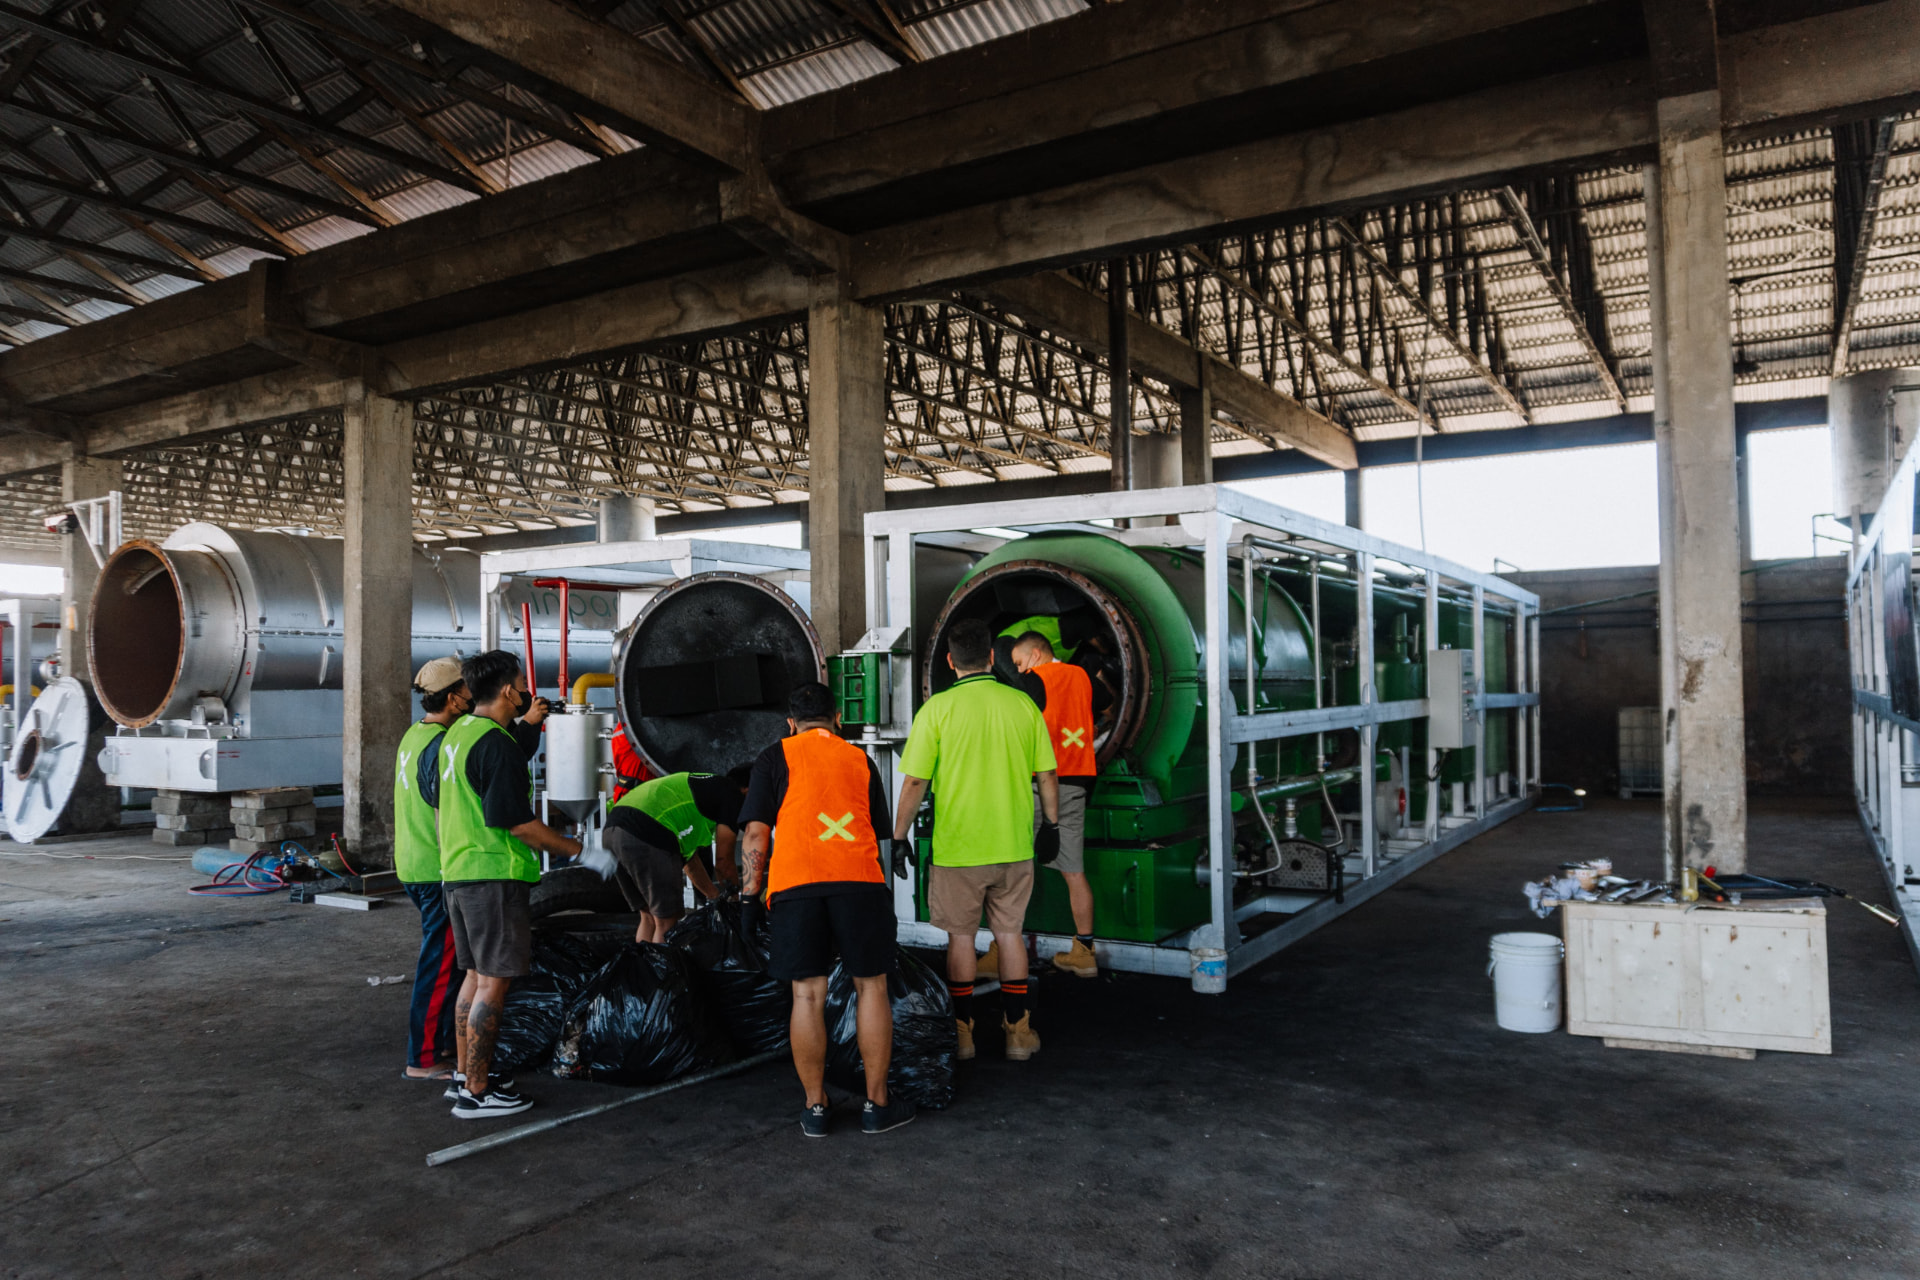
The Klungkung project
INPAC’s waste-to-energy facility is installed and operating at the TOSS Centre in Karangdadi, Kusamba, Klungkung, Bali. Working with the Regency Government and local partners, the facility diverts waste from landfill and uses pyrolysis to convert it without combustion into fuel oil, syngas, biochar and carbon briquettes.
1. Facility Capital Infrastructure (CapEx Allocation)
| Category | Operational Scope | Cost (IDR) | % Share |
|---|---|---|---|
| Machinery & Equipment | Sorting, pyrolysis, distillation, briquetting, balers, MEP controls. | Rp 50,428,210,356 | 87.15% |
| Logistics & Clearance | Shipping transit, inland delivery, customs HS Code 8479 duties. | Rp 5,119,847,937 | 8.85% |
| Engineering Design | Technical layout, civil schematics, MEP sign-offs. | Rp 1,470,744,684 | 2.54% |
| Assembly & Testing | Mechanical/electrical assembly, hot/cold testing. | Rp 573,241,414 | 0.99% |
| Corporate Permitting | Entity setup, statutory compliance, legal, Banjar authorizations. | Rp 352,910,250 | 0.61% |
| Total CapEx | Turnkey municipal facility deployment. | Rp 57,862,564,641 | 100.00% |
2. Operational Expenditure (OpEx) & Outgoings
| Outgoings Line Item | Operational Allocation Basis | Annual (IDR) | Monthly (IDR) | % OpEx |
|---|---|---|---|---|
| Personnel & Labour | 21 staff @ Rp 6.27M/mo average + BPJS statutory coverage. | Rp 1,579,994,640 | Rp 131,666,220 | 11.3% |
| Facility Maintenance | Machine servicing, spare parts, calibration, upkeep. | Rp 644,897,016 | Rp 53,741,418 | 4.6% |
| Utilities & Power | PLN I-3 grid power, water, generator fuel. | Rp 354,706,464 | Rp 29,558,872 | 2.5% |
| Environmental Testing | Quarterly compliance reporting, emissions, water testing. | Rp 236,423,088 | Rp 19,701,924 | 1.7% |
| Administration & Permits | Permit updates, administrative costs, Banjar liaisons. | Rp 163,084,008 | Rp 13,590,334 | 1.2% |
| Capital Loan Repayments | 10% p.a. amortization over 90.4 months on Rp 57.86B CapEx. | Rp 10,964,291,460 | Rp 913,690,955 | 78.6% |
| Total Outgoings | Fully loaded monthly operating and capital cost. | Rp 13,943,396,676 | Rp 1,161,949,723 | 100.0% |
3. Resource Recovery Streams (100% Fuel Model)
Stream 1: Biofuel Yield
Output: 1,441,440 L/annum (71.5% fuel volume) @ 5,500 IDR / L
Monthly Yield: Rp 660,660,000 IDR / month
Stream 2: Refined Diesel Output
Output: 574,560 L/annum (28.5% fuel volume) @ 12,500 IDR / L
Monthly Yield: Rp 598,500,000 IDR / month
4. Financial Performance Summary
| Financial Component | Annual (IDR) | Monthly (IDR) | % Share |
|---|---|---|---|
| Gross Biofuel Off-Take | Rp 7,927,920,000 | Rp 660,660,000 | 52.46% |
| Gross Refined Diesel Off-Take | Rp 7,182,000,000 | Rp 598,500,000 | 47.54% |
| Total Gross Yield | Rp 15,109,920,000 | Rp 1,259,160,000 | 100.0% |
| Base Overhead OpEx | (Rp 2,979,105,216) | (Rp 248,258,768) | 19.7% |
| Capital Loan Repayments (10%) | (Rp 10,964,291,460) | (Rp 913,690,955) | 72.6% |
| Total Outgoings | (Rp 13,943,396,676) | (Rp 1,161,949,723) | 92.3% |
| Net Operational Outcome | Rp 1,166,523,324 | Rp 97,210,277 | 7.7% |